Weapons Crime: year ending December 2017
Weapons crime in England and Wales, involving knives, guns, and other types of weapon.
This page is part of the latest crime collection
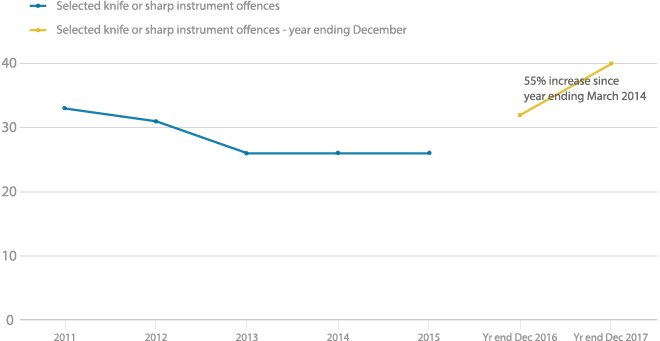
Police recorded 7,130 (22%) more crimes involving weapons
England and Wales, year ending March 2011 to year ending December 2017
Source: Police recorded crime, Home Office
- Knife crime rose 22%
- Gun crime rose 11%
- 63% of the increase in gun crime was driven by rises in London and Manchester
Knife crime reaches a seven-year-high
The police recorded 39,598 offences involving a knife or sharp instrument in the year ending December 2017. This is a 22% increase compared with the previous year (32,468), and the highest number in the seven-years' of available data.
Police recorded crime data are not designated as National Statistics. Not all offences come to their attention, and reporting may be affected by changes in recording practices and police activity.
The number of knife crimes recorded has risen for the past three years. Before this, we saw a general downward trend since the year ending March 2011.
"Assault with injury" and "assault with intent to cause serious harm" made up around half (49%) of all crimes involving a knife or sharp instrument. All categories of weapons crime for which we collect data showed increases.
London's Metropolitan Police saw the largest increase (accounting for 48% of the total increase).
Admissions data for NHS hospitals in England shows a 7% increase in assault by a sharp object. Rising from 4,054 in the year ending March 2016 to 4,351 in the following 12 months.
Possession of a blade or point also rose
Police recorded "possession of an article with a blade or point" offences also rose, by 33%, to 17,437 offences. This is consistent with increases seen over the last four years, and the highest figure since the series began in the year ending March 2009.
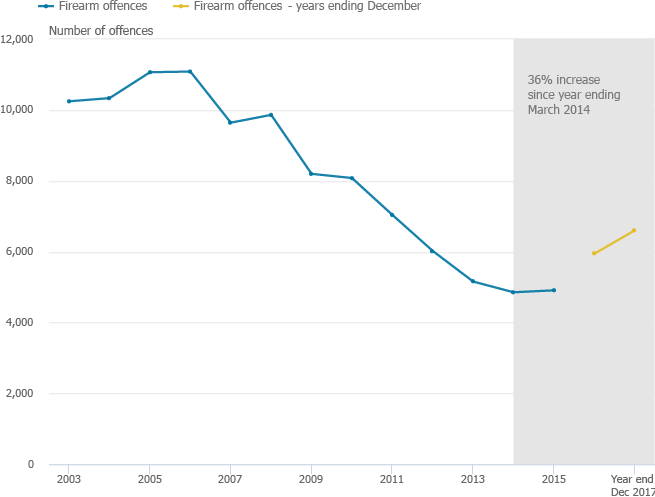
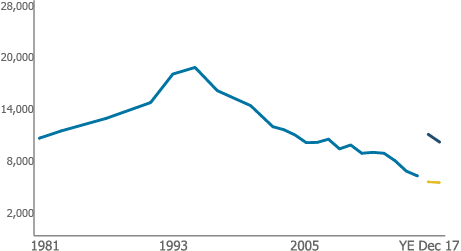
Firearm crimes have increased for the first time since 2005
England and Wales, year ending March 2003 to year ending December 2017
Source: Police recorded crime, Home Office
Download this chart
Offences involving firearms increased by 11% (to 6,604) in the year ending December 2017, compared with the previous year (5,945 offences).
Police recorded a:
- 12% increase in offences involving handguns (accounting for 46% of the overall increase)
- 21% increase in offences involving unidentified firearms
- 20% increase in offences involving shotguns
- NHS England hospital admissions data also shows increases firearm injuries. This rose from 109 admissions in the year ending March 2016 to 135 admissions in the year ending March 2017
London's Air Ambulance Data also suggest an increase in serious offences involving a weapon. In 2017, injuries resulting from stabbings and shootings were the most common cause for a helicopter to be dispatched.
Weapons crime data
This page mainly reports on data from the Crime Survey for England and Wales (CSEW) and police recorded crime.
More information on both these sources can be found in the User guide to crime statistics for England and Wales.
Other data used on this page
Other ONS data
- Offences involving the use of weapons: data tables
- Homicide in England and Wales: Appendix tables
- Home Office knife crime open data table
NHS Digital
London Air Ambulance Data
Using weapons crime data
More pages in this collection
Crime overview
Over the long-term, crime has fallen, but some crimes have risen slightly in the previous 12 months.
Released: 26 April 2018
More about weapons crime
-
The nature of violent crime in England and Wales: year ending March 2017
Long-term trends and the circumstances of violence (do not include the most recent statistics for the year ending December 2017.
-
ONS Focus on Violent Crime and Sexual Offences: Year ending March 2015
Analysis of violent crime, based on the Crime Survey for England and Wales and police recorded crime.
Contact us
Mark Bangs
crimestatistics@ons.gov.uk
+44 (0)2075 928689


