Violent Crime in England and Wales: year ending December 2017
Violent crime including minor assaults, harassment and psychological abuse, wounding, physical assault and death.
Release date: 26 April 2018
Next release: 19 July 2018 (provisional)
This page is part of the latest release | View all pages in this release or view previous releases
Little change in levels of violent crime in recent years
England and Wales, year ending December 1981 to year ending December 2017
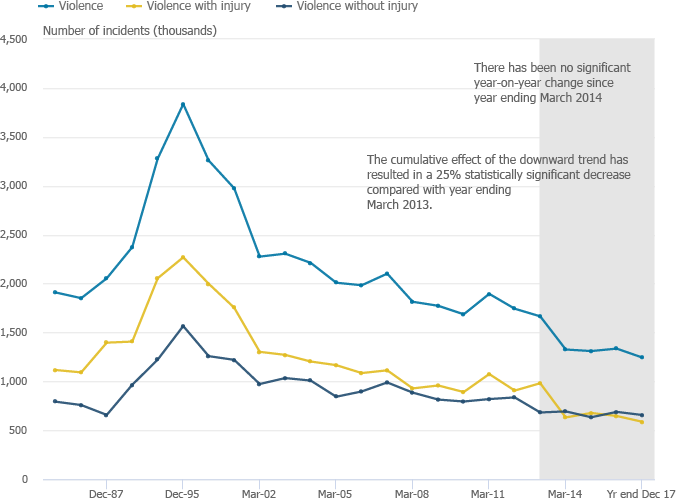
Source: Crime Survey for England and Wales, Office for National Statistics
On this page you can:
- Get an overview of the main findings for violent crime
- Get the data
- Learn how we measure these statistics
- Read a glossary of terms
- Find more pages in this release
- Contact us
Main findings for violent crime
The Crime Survey for England and Wales shows long-term reductions in violent crime but little change in recent years
Around 2 in every 100 adults were a victim of CSEW violent crime in the latest survey year, compared with around 3 in 100 adults in the survey year ending March 2007 and 5 in 100 adults in 1995 (the peak year).
However, in the year ending March 2017, the Crime Survey for England and Wales (CSEW) showed that more than half of violent crime victims (57%) did not report their experiences to the police. This is a return to levels seen preceding the year ending March 2013, following higher levels of reporting in the previous three years.
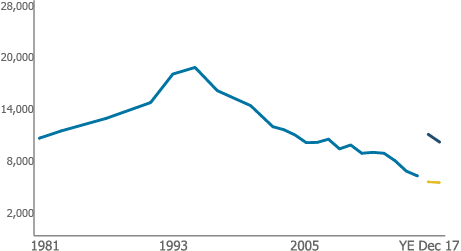
Latest police recorded figures, excluding extraordinary events with multiple victims (like Hillsborough, and terrorist attacks), show that there were 54 more homicides than the previous year, a 9% increase to 653. This continues an upward trend seen in homicides since March 2014, indicating a change to the long-term downward trend seen in the previous decade.
Although the deaths at Hillsborough occurred in 1989, an inquest returned a verdict of manslaughter and therefore was recorded as a homicide in the year 2016.
Police recorded crime
Police recorded crime shows a continuing rises in a number of other violence crime offences – firearm offences and knife or sharp instrument offences.
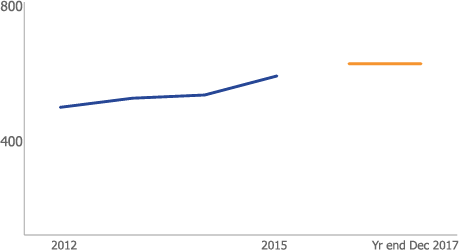
The overall number of offences involving a knife or sharp instrument has seen an increase in the last year, with increases in all offences included within the data collection. The data showed the highest number of offences involving knives or sharp instruments since 2011
The police recorded 39,598 offences involving a knife or sharp instrument in the latest year ending December 2017, a 22% increase compared with the previous year (32,468) and the highest number in the seven-year series (from year ending March 2011), the earliest point for which comparable data are available.
However, in the year ending March 2017, the Crime Survey for England and Wales (CSEW) showed that more than half of violent crime victims (57%) did not report their experiences to the police. This is a return to levels seen preceding the year ending March 2013, following higher levels of reporting in the previous three years.
Long-term reductions in violent crime supported by other data
The longer-term reductions in violent crime (as shown by the CSEW) are seen by recent admissions data for NHS hospitals in England. Assault admissions for the year ending March 20172 (26,450) are 42% lower than the year ending March 2007 (45,890).
Research conducted by the Violence and Society Research Group at Cardiff University (PDF, 502KB) shows similar findings. Results from their annual survey of a sample of hospital emergency departments and walk-in centres in England and Wales, show that serious violence-related attendances in 2017 have fallen 39% since 2010. However, similar to the latest CSEW findings, the latest data show little change in 2017 compared with 2016 (1% increase).
Get the data
This bulletin mainly reports on data from two sources of crime data: the Crime Survey for England and Wales (CSEW) and police recorded crime.
More information on both these sources can be found in the User guide to crime statistics for England and Wales.
More about the data used in this bulletin
Data on homicide offences given in these police recorded crime data will differ from data from the Home Office Homicide Index, which are published annually by ONS, last released as part of Homicide in England and Wales: year ending March 2017.
Estimates of violence against 10-to-15-year-olds, as measured by the CSEW, can be found in Appendix tables A9, A10, A11 and A12. The estimates are not directly comparable with the main survey of adults, so are not included in the headline totals.
Hospital Admitted Patient Care Activity, 2016-17 and Hospital Episode Statistics, Admitted Patient Care – England, 2006-07 provided by NHS Digital.
Information about these statistics

More pages in this release
Crime in England and Wales
Over the long-term, crime has fallen, but some crimes have risen slightly in the previous 12 months.
Released: 26 April 2018
Fraud in England and Wales
No change in the volume of fraud offences in the last year
Released: 26 April 2018

Weapons crime in England and Wales
Police recorded 7,130 (22%) more crimes involving weapons, with knife crime in cities rising most.
Released: 26 April 2018