Labour market
Latest estimates of employment, unemployment, economic inactivity and other employment-related statistics for the UK.
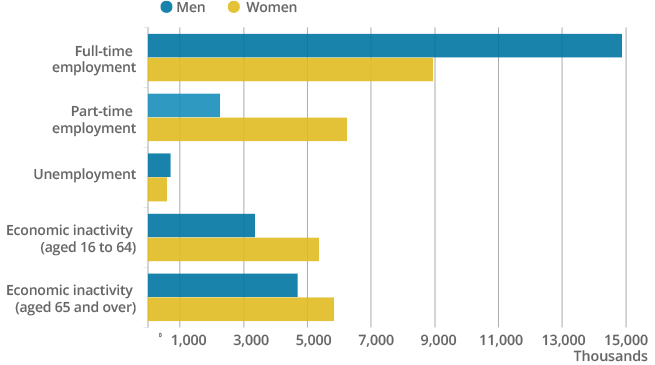
Number of people in employment increases
April to June 2018, seasonally adjusted

Source: Labour Force Survey, Office for National Statistics

Between January to March 2018 and April to June 2018, the numbers of people in work and economically inactive increased while the numbers of unemployed people decreased.
Richard Clegg, Head of Labour Market Statistics
On this page:
- Analysis of labour market
- Labour market data
- Glossary
- Measuring this data
- Strengths and limitations
- Find out more
- You may also be interested in
- Contact us
Pages in this collection:
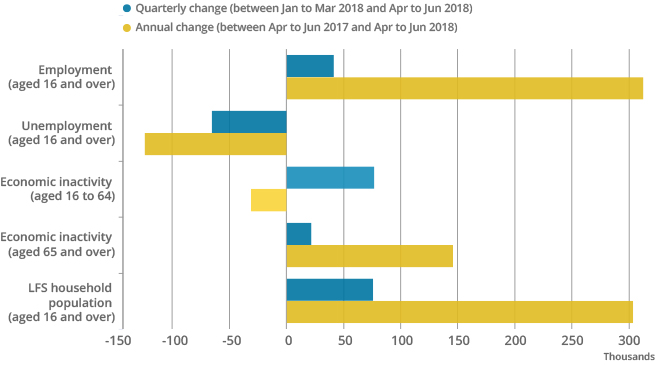
Comparing April to June 2018 with January to March 2018 provides most robust short-term comparison
Quarterly and annual changes in the number of people in the UK labour market, seasonally adjusted

Source: Labour Force Survey, Office for National Statistics
Download this chart
Table 1: Summary of labour market statistics for April to June 2018, seasonally adjusted
| Number (thousands) | Change on Jan to Mar 2018 | Change on Apr to Jun 2017 | Headline Rate (%) | Change on Jan to Mar 2018 | Change on Apr to Jun 2017 | |
|---|---|---|---|---|---|---|
| Employed | 32,386 | 42 | 313 | |||
| Aged 16 to 64 | 31,154 | 7 | 249 | 75.6 | 0.0 | 0.4 |
| Aged 65 and over | 1,231 | 35 | 64 | |||
| Unemployed | 1,360 | -65 | -124 | 4.0 | -0.2 | -0.4 |
| Aged 16 to 64 | 1,343 | -60 | -122 | |||
| Aged 65 and over | 17 | -5 | -2 | |||
| Inactive | 19,298 | 99 | 115 | |||
| Aged 16 to 64 | 8,735 | 77 | -31 | 21.2 | 0.2 | -0.1 |
| Aged 65 and over | 10,564 | 22 | 146 |
Source: Office for National Statistics
Notes:
- Headline employment rate: the number of employed people aged from 16 to 64 years divided by the population aged from 16 to 64 years. Population is the sum of employed plus unemployed plus inactive.
- Headline unemployment rate: the number of unemployed people aged 16 years and over divided by the sum of employed people aged 16 years and over plus unemployed people aged 16 years and over.
- Headline economic inactivity rate: the number of economically inactive people aged from 16 to 64 years divided by the population aged from 16 to 64 years. Population is the sum of employed plus unemployed plus inactive.
- Components may not sum exactly to totals due to rounding.
Download this table
Labour market data
-
A01: Summary of labour market statistics
Released: 14 August 2018
Labour market statistics summary data tables.
-
Released: 14 August 2018
Labour Force Survey summary. Shows the headline employment, unemployment and inactivity series (not seasonally adjusted).
Using labour market data
Find out more
-
Sickness absence in the labour market
The latest figures for 2017 show that the average number of sickness absence days that UK workers take has almost halved since 1993.
-
International immigration and the labour market
The labour market characteristics of UK, EU and non-EU nationals in the UK labour market in 2016.
-
Graduates in the labour market
Employment, skill level of jobs, industry, pay, unemployment and comparison of male and female graduates.
-
Trends in self-employment in the UK
Analysing the characteristics, income and wealth of the self-employed.
You may also be interested in
- Labour market economic commentary
- Regional Labour market statistics release
- Public sector employment release
- Young People not in Education, Employment or Training (NEET)
- Working and workless households in the UK
- Business Register and Employment Survey release
- Sickness absence in the labour market
- International immigration and the labour market
Contact us
Richard Clegg
labour.market@ons.gov.uk
+44 (0)1633 455400
