Employment and unemployment
Latest estimates of the number of people in paid work in the UK.
People in work shows steady increase
UK employment rate, January to March 1971 to April to June 2018, seasonally adjusted

Source: Labour Force Survey, Office for National Statistics
- Lowest employment rate was 65.6% in 1983
- The employment rate for April to June 2018 was 75.6%
On this page:
- Analysis of employment
- Data used in this analysis
- Glossary
- Measuring this data
- Strengths and limitations
- Find out more
- You may also be interested in
- Contact us
Pages in this collection:
Proportion of people in work has generally increased since 2012
The lowest employment rate for people was 65.6% in 1983, during the economic downturn of the early 1980s. The employment rates for people, men and women have been generally increasing since early 2012. For the latest time period, April to June 2018, the employment rate for people was 75.6%, up from 75.1% for a year earlier.
Employment measures the number of people aged from 16 to 64 years in paid work. It differs from the number of jobs because some people have more than one job.
For April to June 2018:
- 75.6% of people aged from 16 to 64 years were in work, up from 75.1% for a year earlier
- 80.1% of men aged from 16 to 64 years were in work; the employment rate for men has not been higher since February to April 1991
- 71.0% of women aged from 16 to 64 years were in work, up from 70.5% for a year earlier
The increase in the employment rate for women over the last few years has been partly due to ongoing changes to the State Pension age for women, resulting in fewer women retiring between the ages of 60 and 65 years.
For April to June 2018, there were 32.39 million people in work, 42,000 more than for January to March 2018 and 313,000 more than for a year earlier.
The following figure shows that more than half of the annual increase in the number of people in employment (313,000) was due to more women in full-time employment (170,000), with the number of men in full-time employment increasing by 101,000 over the year.
Figure 4: Changes in people in employment in the UK between April to June 2017 and April to June 2018, seasonally adjusted
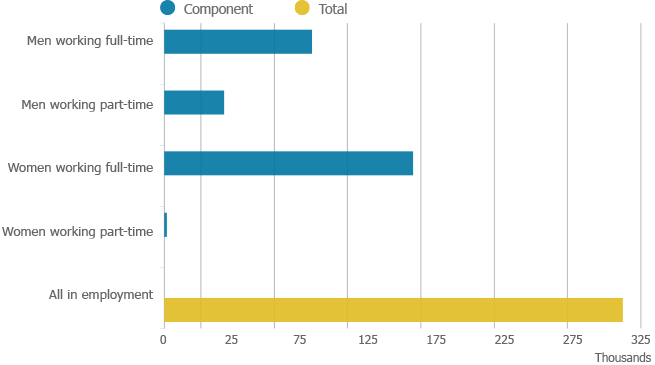
Source: Labour Force Survey, Office for National Statistics
Download this chart
Number of self-employed people falls
Comparing the estimates for employees and self-employed people for April to June 2018 with those for a year earlier:
- employees increased by 369,000 to 27.45 million (84.8% of all people in work)
- self-employed people decreased by 38,000 to 4.77 million (14.7% of all people in work)
Employees and self-employed people do not account for all people in employment as there are two minor additional categories; unpaid family workers and people on government-supported training and employment programmes.
Fewer workers on zero-hours contracts
Comparing the estimates for employment by nationality (not seasonally adjusted) for April to June 2018 with those for a year earlier:
- UK nationals working in the UK increased by 332,000 to 28.76 million
- EU nationals working in the UK fell by 86,000 to 2.28 million (the largest annual fall since comparable records began in 1997)
- non-EU nationals working in the UK increased by 74,000 to 1.27 million
For April to June 2018, there were 780,000 people (not seasonally adjusted) in employment on “zero-hours contracts” in their main job, 104,000 fewer than for a year earlier. The industrial sector showing the largest annual fall in the number of people in employment on “zero hours contracts” was human health and social work (down 62,000). Detailed estimates of people in employment on “zero-hours contracts” are available at dataset EMP17.
Employment data
Data used in this analysis
-
Employment, unemployment and economic inactivity
Time period: January 1971 - June 2018
-
Full time, part time and temporary workers
Time period: January 1971 - June 2018
-
Time period: January 2000 - June 2018
Other data avaliable
-
Employment by country of birth and nationality
Time period: January 1971 - June 2018
Employment by country of birth and nationality
Time period: January 1971 - June 2018